

Turn Raw Data into
Business Decisions.
In Real-Time.
The Reporting Challenges Every Organization Faces
Data is everywhere - ERP, HR, CRM, spreadsheets, legacy systems - but getting a single, accurate, real-time view of business performance remains painfully difficult.
Scattered Data Silos
Data lives in ERP, HR, CRM, spreadsheets, and legacy databases. No single source of truth. Every department has its own version of the numbers.
IT Bottleneck for Every Report
Every new report or data request goes through IT. Weeks of waiting. Business users can’t self-serve. IT becomes a reporting factory instead of a strategic function.
Excel Hell
Massive spreadsheets emailed between departments. Manual copy-paste. Formula errors. Version conflicts. No audit trail. The “single spreadsheet” everyone depends on.
No Real-Time Visibility
Dashboards updated weekly or monthly - if at all. By the time data is compiled, it’s already stale. Decisions made on outdated information.
Manual ETL & Data Prep
Data extraction done manually. CSV exports, Access databases, ad-hoc SQL queries. No systematic, scheduled, automated data pipeline.
No Dimensional Analysis
Business users can’t slice and dice data by time, product, region, or department without asking IT. No OLAP cubes. No pivot-ready models.
Inconsistent KPIs
Sales says revenue is X. Finance says Y. Operations has a different number. No standardized, governed KPI definitions across the organization.
No Self-Service Culture
Business users are consumers, not analysts. They wait for IT to run queries instead of exploring data themselves. Zero analytical empowerment.
Scaling Nightmare
As data grows, performance degrades. Spreadsheets crash. Queries time out. No architecture designed for scale, concurrency, or historical depth.
Full Stack BI. One Microsoft Platform. Zero IT Dependency.
Agile BI 365 delivers a complete, production-grade business intelligence stack - from data ingestion to executive dashboards - built entirely on the Microsoft data platform. We don’t just build reports. We build the entire data infrastructure that powers them.
Business users connect to OLAP cubes from Excel, drag and drop dimensions, and get instant pivot-table analysis - no SQL, no IT tickets, no waiting. Power BI dashboards refresh automatically. Every department gets its own analytical universe.
- SSIS-powered ETL pipelines connecting any data source
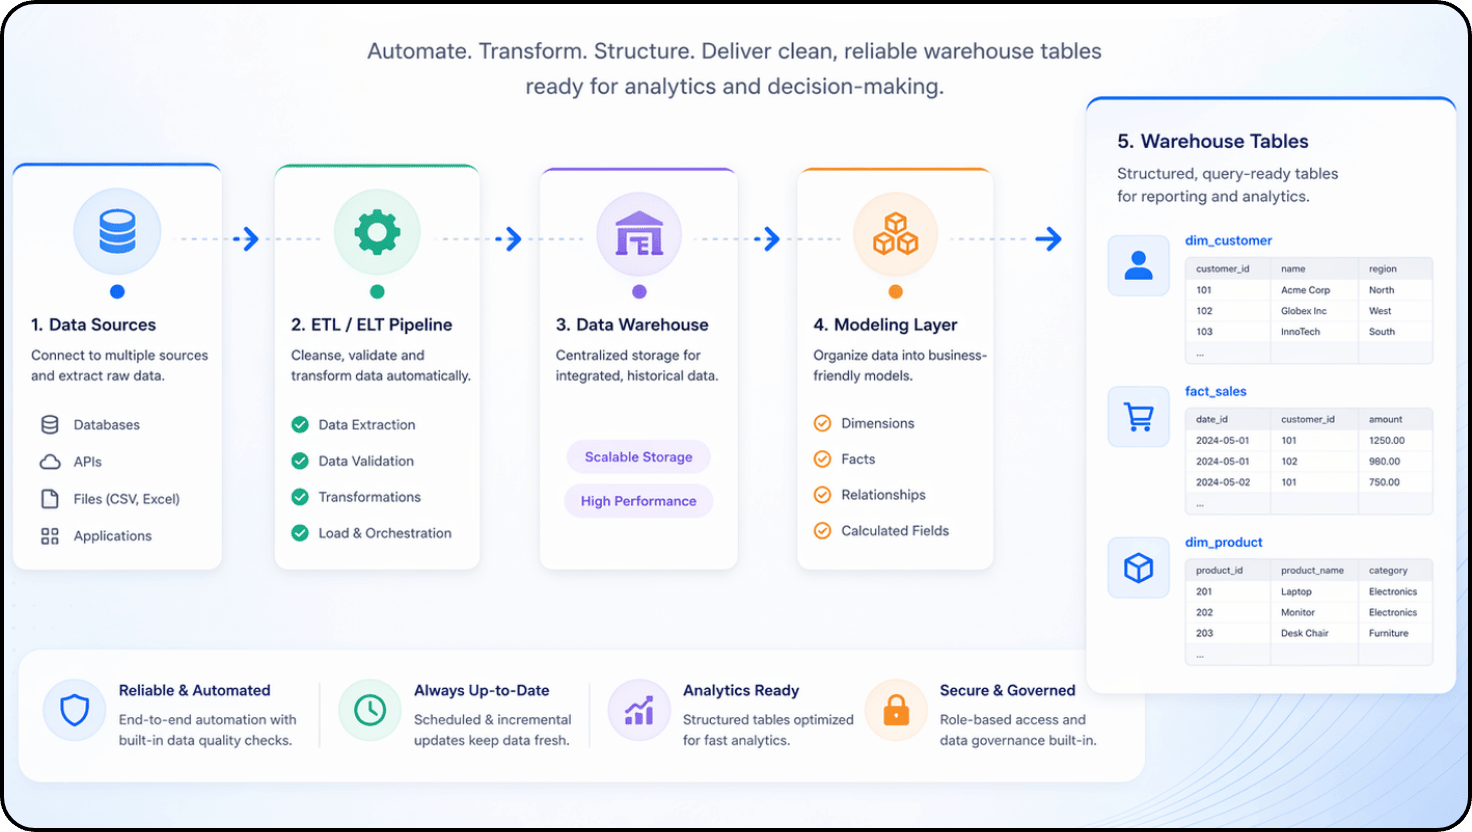
- Structured star-schema data warehouse on MS SQL Server
- OLAP cubes per department/business unit for multidimensional analysis
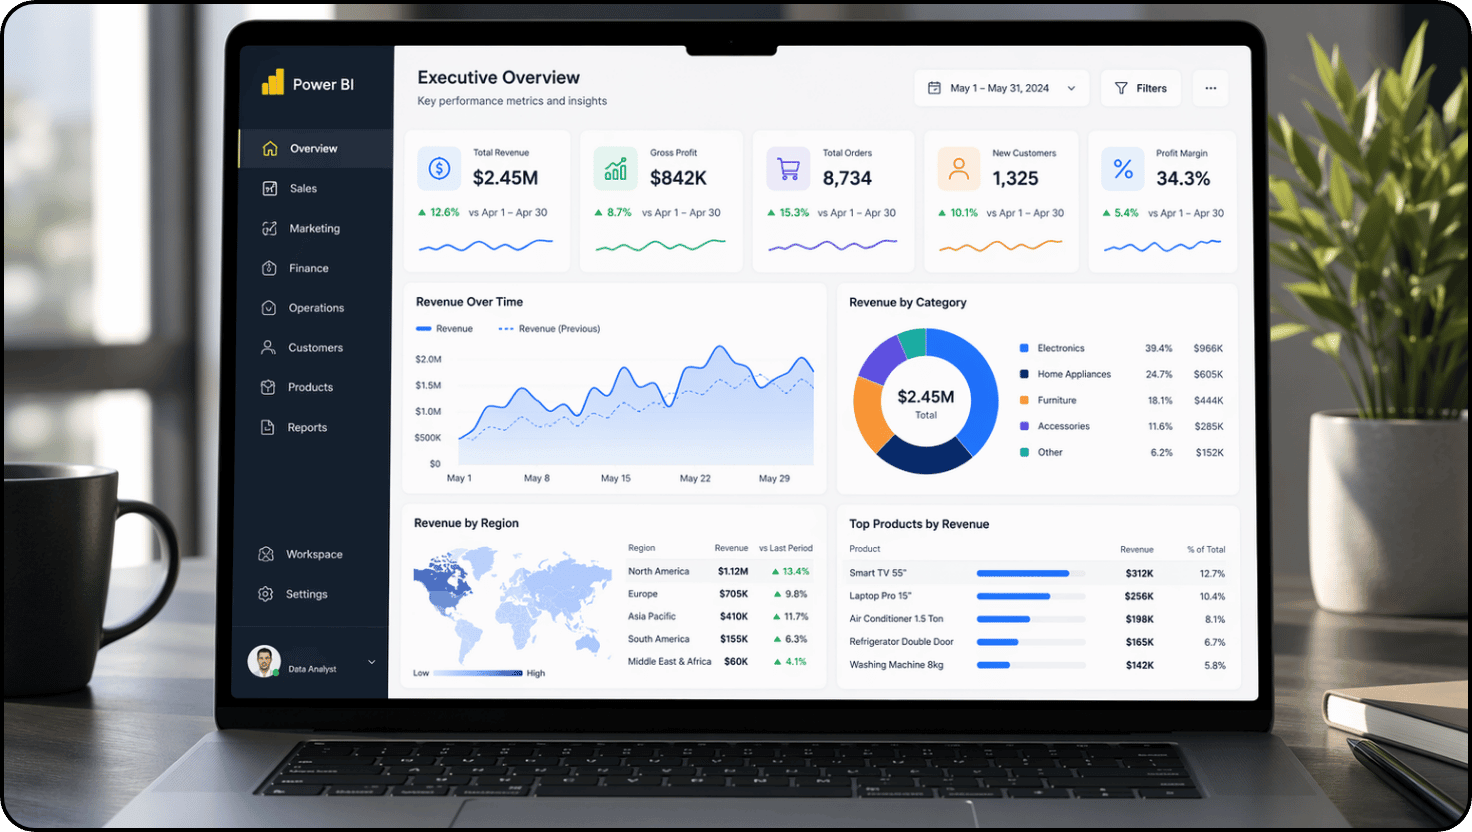
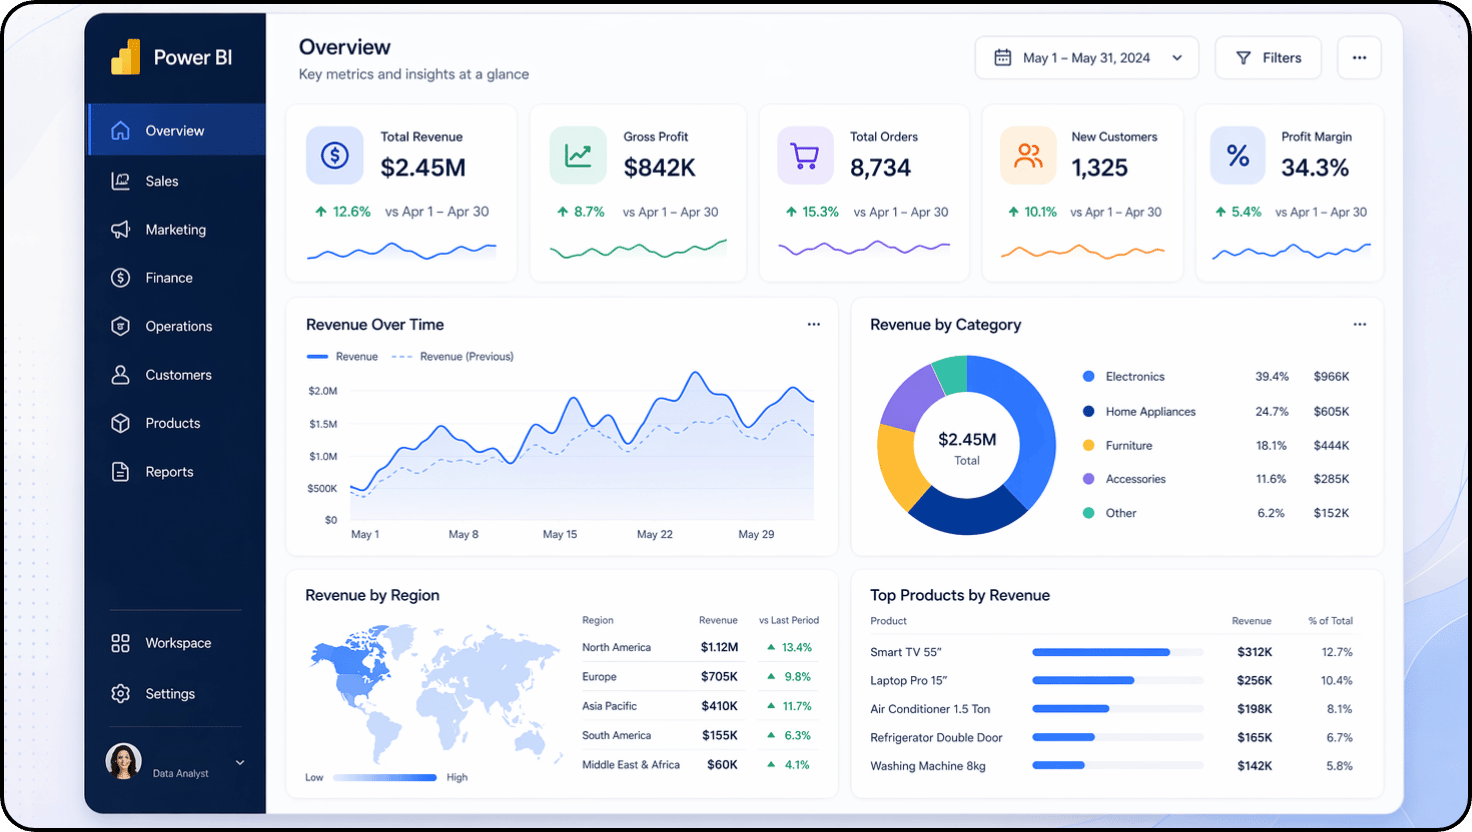
- Interactive Power BI dashboards with scheduled refresh
- Self-service Excel connectivity - pivot tables on live cubes
- Standardized KPI definitions across the entire organization
- Cloud-ready migration path to Microsoft Fabric
- Dramatically reduces IT dependency for everyday reporting
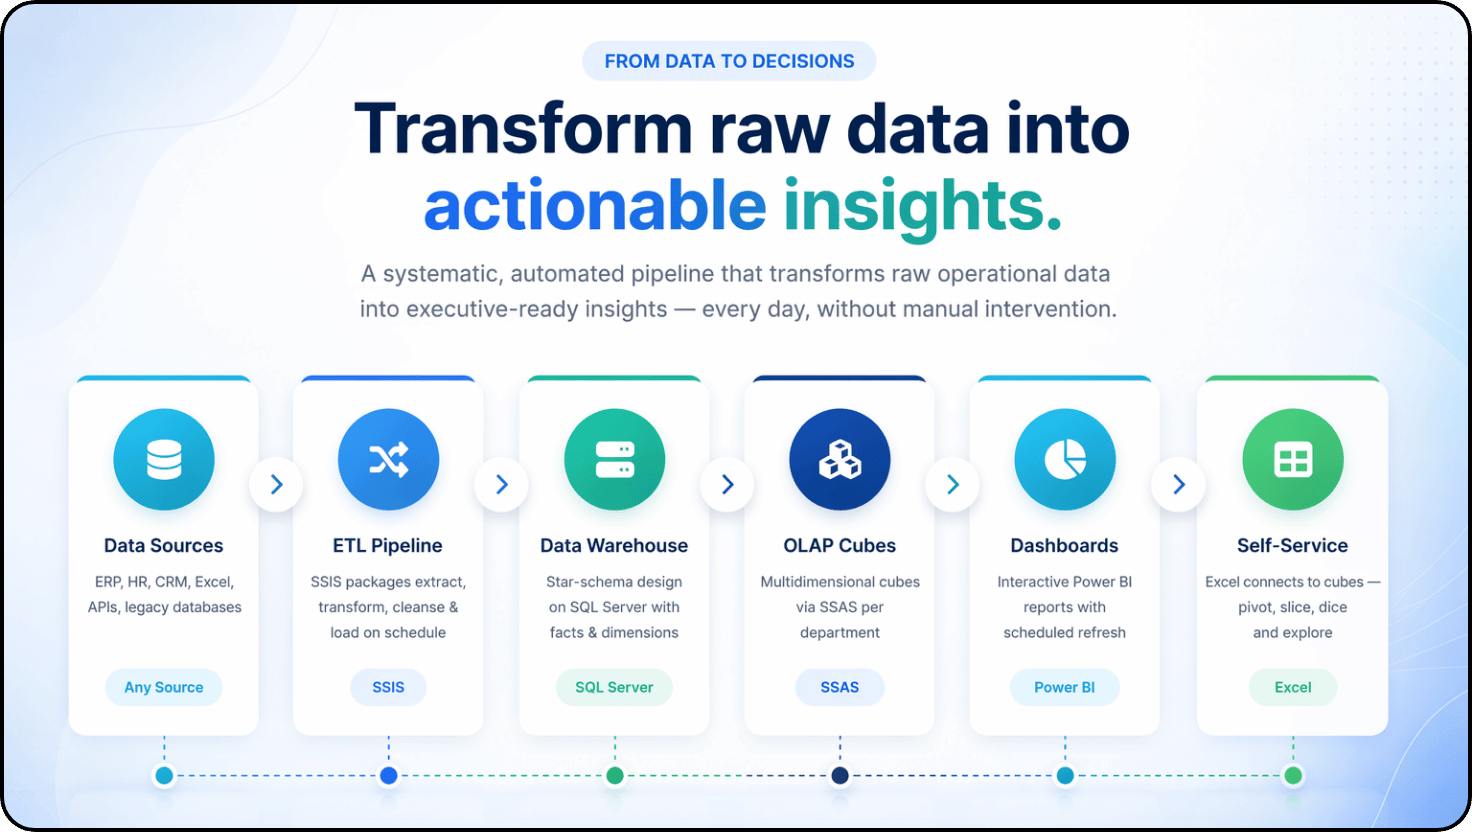
How Data Flows - From Source to Insight
A systematic, automated pipeline that transforms raw operational data into executive-ready insights - every day, without manual intervention.
Data Sources
ERP, HR, CRM, Excel, APIs, legacy databases
Any SourceETL Pipeline
SSIS packages extract, transform, cleanse & load on schedule
SSISData Warehouse
Star-schema design on SQL Server with facts & dimensions
SQL ServerOLAP Cubes
Multidimensional cubes via SSAS per department
SSASDashboards
Interactive Power BI reports with scheduled refresh
Power BISelf-Service
Excel connects to cubes - pivot, slice, dice
ExcelEvery Layer of Your Data Stack - Covered
From data extraction to self-service analytics - every component of a production-grade BI platform, engineered on the Microsoft stack.
Empower Every Department to Analyze Their Own Data
Business users connect Excel to live OLAP cubes, build their own pivot tables, and explore data across dimensions - without writing a single line of SQL or filing an IT ticket.
Finance & Accounting
P&L analysis, budget vs. actual, cost center drill-down, cash flow trends, revenue by product line - all self-serve from Excel.
Sales & Distribution
Revenue by region, customer, product. Pipeline analysis, trend comparison, quota tracking. Territory-level performance in seconds.
Operations & Supply Chain
Inventory turns, order fulfillment rates, supplier performance, production metrics. Real-time operational intelligence.
Human Resources
Headcount analytics, attrition trends, payroll analysis, leave patterns, recruitment metrics. HR analytics without IT.
Service & Warranty
Service turnaround, warranty claims, technician performance, parts consumption. Service analytics that drive efficiency.
Executive Leadership
Organization-wide KPIs, strategic scorecards, trend analysis, cross-department comparisons. The full picture, instantly.
Ready for the Cloud? We Deploy on Microsoft Fabric.
When your organization is ready to move to the cloud, we migrate the entire BI stack to Microsoft Fabric - Microsoft’s unified analytics platform that brings together data engineering, data warehousing, real-time analytics, and Power BI in one SaaS experience.
Same architecture. Same data models. Same self-service experience. Just cloud-native, infinitely scalable, and always available.
- OneLake - unified data lake for all analytics
- Data Factory for cloud ETL pipelines (replaces SSIS)
- Synapse Data Warehouse - serverless & scalable
- Power BI natively integrated - no gateway needed
- Real-Time Analytics with KQL databases
- Copilot AI for natural language data queries
- Pay-as-you-go - no hardware to manage
OneLake
Unified data lake for all analytics workloads
Data Factory
Cloud-native ETL pipelines & orchestration
Synapse Warehouse
Serverless, scalable cloud data warehouse
Power BI Integrated
Native dashboards - no gateway required
Your Data. Your Insights. Your Decisions.
Built on the Microsoft data platform. Deployed on-premise or on Microsoft Fabric. Maintained and supported by Agile Solutions - Nepal’s #1 Microsoft ERP & BI partner.
Why Organizations Choose Agile for Business Intelligence
We don’t just build dashboards. We build the complete data infrastructure - from pipeline to self-service - that transforms how your organization uses data.
100% Microsoft Stack
SQL Server, SSIS, SSAS, Power BI, Excel, Fabric. No third-party tools. Unified licensing. Full compatibility.
True Self-Service
Business users connect Excel to live OLAP cubes. Pivot tables on enterprise data. No SQL. No IT tickets.
OLAP Cubes per Department
Finance, Sales, HR, Operations - each gets a dedicated cube. Pre-aggregated for speed. Built for analysis.
Cloud Migration Path
Start on-premise with SQL Server. Migrate to Microsoft Fabric when ready. Same models. Same reports. Zero rewrite.
Star Schema Architecture
Proper dimensional modeling with fact & dimension tables. Not just reports on raw data - a real data warehouse.
Enterprise Security
Row-level security in warehouse, cubes, and Power BI. Users see only what they should. Governance built in.
Automated Pipelines
SSIS packages run on schedule via SQL Agent. No manual extraction. No CSV exports. Data flows automatically.
17+ Years of BI Expertise
Building data warehouses and BI solutions since 2008. Deep expertise in Microsoft data platform & analytics.
Rapid Time to Value
Phase 1 dashboard in 4–6 weeks. Complete data warehouse in 3–6 months. Measurable ROI from day one.
Ready to Turn Your Data into Decisions?
See how Agile BI 365 can eliminate reporting chaos and give every department self-service analytics - schedule a personalized demo today.